A 2023 study by the NC Dept. of Environmental Quality sheds more light on the amount of PFAS that industrial facilities, factories and landfills are discharging into our local water supply.
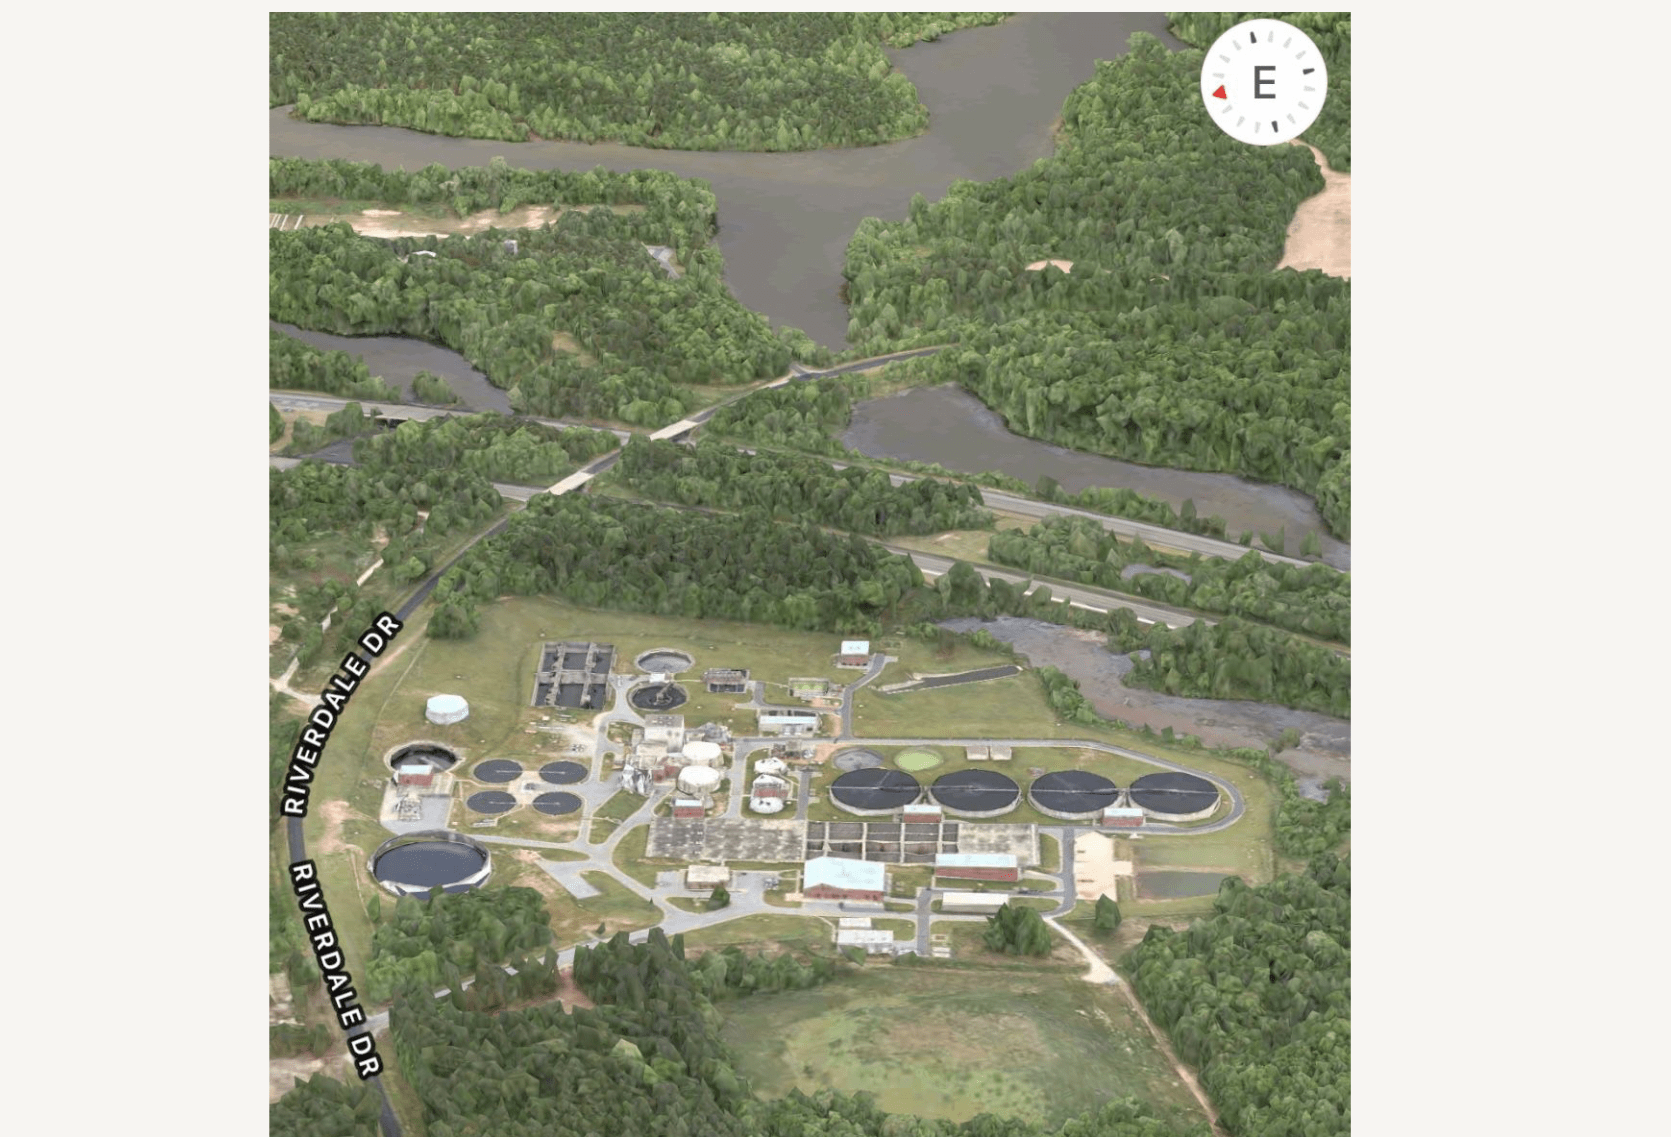
Released in December 2025, the results provide a snapshot of the type and total PFAS analytes that exist in the wastewater flowing INTO and OUT OF several dozen treatment facilities, including High Point’s Eastside Wastewater Treatment Plant (WWTP) on Riverdale Drive in Jamestown.
Eastside was one of 37 plants (from 27 counties) in the study, selected based on the facilities’ size (water flow); existing PFAS data; and the type of industrial facilities and landfills sending wastewater to the plants (“Significant Industrial Users”).
At the time the testing was done, Eastside reported it was receiving industrial wastewater from a total of 17 “Significant Industrial Users.” According to their most recent Pretreatment Inspection, that number has grown to 22.
“Total PFAS” represents the sum of all PFAS compounds quantified in a given sample, providing a way to broadly compare overall levels among similar samples that have been analyzed in the same way. The study also measured PFAS in treated solid material removed from the wastewater sludge (biosolids), much of which is being used in land applications and fertilizer.
Eastside Wastewater Treatment Plant, outflows to Deep River/Randleman Lake
Total PFAS measured in incoming industrial wastewater (INFLUENT): 226.30 ppt (parts per trillion)
Total PFAS measured in outflow to Deep River/Randleman Lake (EFFLUENT): 137.598 ppt
Highest levels: PFPeA, PFPrA, PFOS, PFOA, PFBA
Total PFAS in Biosolids: 51.556 ng/g (51,556 ppt)
Asheboro Wastewater Treatment Plant, outflows to Deep River via Haskett’s Creek
Total PFAS in INFLUENT: 447.40 ppt
Total PFAS in EFFLUENT: 110.847 ppt
Highest levels: PFPrA
Total PFAS in Biosolids: 92.37 ng/g (92,370 ppt)
Winston Salem (Elledge) Wastewater Treatment Plant, outflows to Salem Creek/Muddy Creek
Total PFAS in INFLUENT: 92.33 ppt
Total PFAS in EFFLUENT: 287.047 ppt
Highest levels: PFPrA
Total PFAS in Biosolids: 825.40 ng/g (825,400 ppt)
Lumberton Wastewater Treatment Plant, outflows to the Lumber River, merges with the Pee Dee River in South Carolina
Total PFAS in INFLUENT: 21,989.30 ppt
Total PFAS in EFFLUENT: 20,642.71 ppt
Total PFAS in Biosolids: 1,288.09 ng/g (1,288,090 ppt)
The City of Lumberton is paid by GFL (a Canadian landfill operator) to accept leachate from GFL’s Sampson County Landfill.)
Northeast Brunswick County Wastewater Treatment Plant, outflows to the Cape Fear River (Be sure to read Clean Cape Fear’s post about the results HERE.)
Total PFAS in INFLUENT: 134 ppt
Total PFAS in EFFLUENT: 216 ppt
Highest level: PFMOAA (Chemours-specific)
Total PFAS in Biosolids 836 ng/g (836,000 ppt)
Carolina Beach Wastewater Treatment Plant, outflows to the Cape Fear River/Atlantic Ocean
Total PFAS in INFLUENT: 123.45 ppt
Total PFAS in EFFLUENT:: 140.67 ppt
Total PFAS in Biosolids: 98.35 ng/g (98,350 ppt)
In its summary statement, the NCDEQ said the majority of wastewater treatment plants had influent and effluent detections above 4.0 ppt for PFOA and/or PFOS, the federal maximum contaminant level in drinking water for these two compounds. Read more about the study and biosolids HERE.
