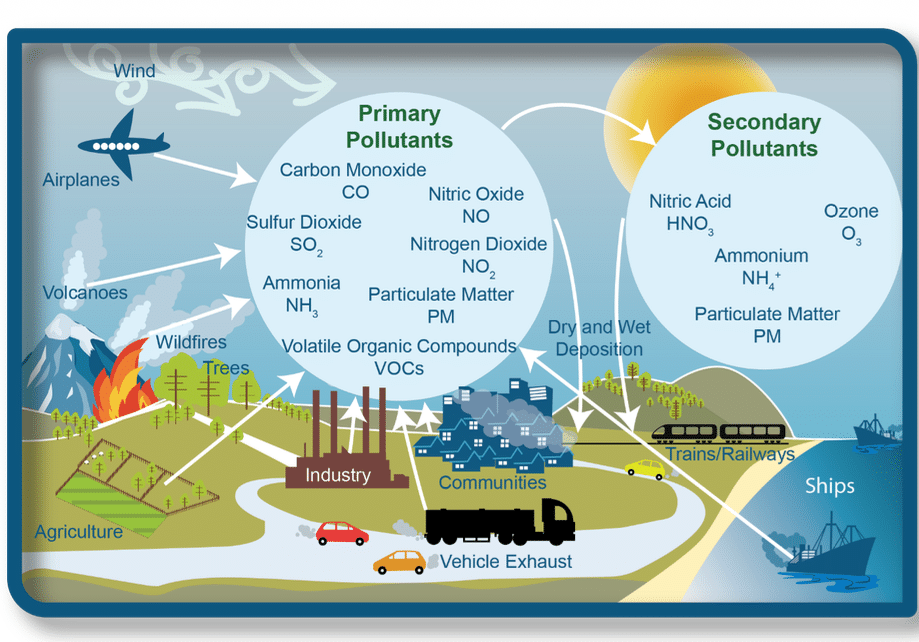
Jamestown’s community air monitoring project tracked Particulate Matter 2.5 from November 2024 through April 2026, made possible with loaner sensors and support from the U.S. Environmental Protection Agency Region 4 office in Atlanta.
Our project involved placing sensors at the homes of eight resident-volunteers within the Jamestown, NC 27282 zip code:

The goal was to expand our knowledge of air quality monitoring, measurement, definitions and devices, engage the local community in the process, and hopefully educate ourselves on air quality basics, especially with respect to particulate matter.
In the months leading up to the submission of our application, Jamestown residents had been growing more concerned about the effects of unmonitored industrial discharge and hazardous sites on the water supply streams that flow through our town.
As some of the residents began reading and sharing public records (environmental assessments, inspections, ECHO reporting), they learned that the pollutant sources in our community were also releasing unhealthy emissions into our air.
Throughout this document, reference is made to “Jamestown 27282” instead of the “Town of Jamestown” because there is a significant difference: Jamestown 27282 consists of 14.4 square miles, shares municipal authority with Greensboro and High Point, and has 15,712 residents. The Town of Jamestown is a 4.4 square-mile subset of Jamestown 27282, with 3,800 residents.
A year and a half of data downloaded from eight sensors shows PM2.5 matter in Jamestown 27282 is higher than the national average of 7.3 µg/m³ and it is trending higher.
The loaner sensors have been returned to the EPA, but we continue to monitor air quality via Purple Air sensors purchased by Jamestown residents. Our hope is that we can expand air quality monitoring here, with the support of the Town and the EPA, to include greenhouse gases and volatile organic compounds.
SITE SELECTION
The Quality Assurance Project Plan (QAPP) Location Specific Deployment Worksheet was submitted to the EPA in July, 2024, and the Project Agreement was signed on November 1, 2024.

At that time, there were no air sensors actively monitoring particulate matter in or near Jamestown. The closest sensor was a device monitoring PM10 at Mendenhall School in Greensboro (AQS 081-0013), located 10.81 miles northeast of Jamestown Town Hall (as the crow flies).
The eight sensor sites were selected based on location, wifi access, and interest exhibited by the host residents. To find those sites, we relied on a community social media network that was already in place, consisting of The Jamestowner Facebook page and the Jamestown United Facebook group.
The sensors were registered and installed during the period November 8th – 12th, 2024.

The northernmost sensor site (“NORTH JAMESTOWN”) was in the Jamesford Meadows neighborhood, in a backyard location with a tree canopy. Some of the highest PM2.5 readings were from this site.
The southernmost site (“RIVERDALE”) was about three quarters of a mile north of the Eastside Wastewater Treatment Plant (which is approximately 4 miles south of Jamestown Town Hall).
The RIVERDALE site is close to the massive Martin Marietta rock quarry, an asphalt plant, Kersey Valley and GFL landfills, and Eastside Wastewater Treatment Plant – all of which are releasing pollutant emissions, dust, and/or particulate matter to the air. High PM2.5 readings also came from this site, which was no surprise since we’ve seen the air emission reports and experienced the foul fumes that are unbearable at times. The Eastside odor was noticeable each time I visited this sensor site, but it was sickening on the day we removed the sensor in May (2026).
Eastside WWTP has received numerous violations for excessive releases of carbon monoxide, and has an ongoing record of noncompliance issues with Mercury emissions, most recently involving the facility’s inability to meet a minimum removal efficiency of 70% under an EPA Alternate Monitoring Plan (AMP) for CD-04, 40 CFR Part 60 Subpart MMMM.
At the time this report was written (July 21, 2026), the 2nd quarter 2026 Mercury emissions test required by the EPA’s AMP had not yet been conducted because “sewage sludge incinerator ID ES-01 has been offline since March 3, 2026, due to persistent fluidization problems and the excessive use of diesel fuel required to maintain bed temperature.” [source: July 15, 2026 letter from Brian Phillips, Chief, Technical Services Section, Division of Air Quality, NCDEQ to Derrick Boone, Assistant Water Resources Director, City of High Point]


Of particular concern is the fact that the amount of greenhouse gases, criteria pollutants, HAPs and TAPs released at Eastside WWTP continues to increase.
According to the facility’s 2025 AERO Air Pollutant Point Source Emissions Inventory, PM10 emissions increased 18.6% over calendar year 2024, and PM2.5 increased 19%. Methane air emissions in 2025 increased 55% over 2024; VOCs increased 32%; Nitrogen Oxides 32%; Carbon Monoxide 82%; Sulfur Dioxide 65%; Beryllium 82%; Cadmium 212%; and Chromic Acid VI, Mercury, Nickel, Benzo(a)pyrene, Acetaldehyde, Acrolein, Xylene and Formaldehyde emissions all increased 54% over the prior year. This is on top of three-digit increases in emissions of PM2.5, Lead and Nickel from 2023 to 2024: https://thejamestowner9.com/eastside-air-emissions-2024/
Kersey Valley Landfill sits .75 miles to the northwest of the RIVERDALE site, and 2.88 miles (as the crow files) south of Jamestown Town Hall. The amount of greenhouse gases, criteria pollutants, HAPs and TAPs released at Kersey Valley Landfill increased even more than at Eastside WWTP.
According to Kersey Valley Landfill’s 2025 AERO Air Pollutant Point Source Emissions Inventory, ALL of the HAP emissions in calendar year 2025 increased by at least 51% over 2024, except for formaldehyde, 1,4-Dioxane, Methyl ethyl ketone. VOCs at Kersey Valley increased 60% in 2025 over 2024. The Particulate Matter criteria pollutants and Sulfur Dioxide emissions were “not reported.”
In 2024, 1,4-Dioxane air emissions at Kersey Valley Landfill increased 1,159% (34 pounds) over 2023 (2.7 pounds).
We could find no air permit nor air emission records for the GFL Construction & Demolition Landfill, which sits next to Kersey Valley Landfill. GFL Landfill is often referred to in NCDEQ records as “WI High Point Landfill” which can be misleading since it is not owned by the City of High Point. It is shown on the NCDEQ interactive map as a “post-closure” site but it is a very active landfill. https://thejamestowner9.com/gfl-history/
Two of the sensor sites are labeled “MACKAY1” and “MACKAY2.” These sites were chosen because of their proximity to the 1,500-home D.R. Horton Kinsley development that is currently underway.
Prior to starting construction, D.R. Horton began razing the 467-acre parcel of forested farmland formerly known as the Johnson farm. Dust from the soil was covering cars, sidewalks, porches and homes in the vicinity, and residents at one of the sensor sites complained of coughing and respiratory problems. MACKAY1 was placed at this residence. MACKAY2 was located directly across the street from the northwest corner of the D. R. Horton development at a residence in the Jordan Creek neighborhood.
MACKAY1 was the closest sensor to the Alberdingk Boley plant, a plastics/resin manufacturer in the middle of Jamestown’s residential and retail communities on the east side of town. Alberdingk Boley has been the subject of several complaints and violations related to air emissions and industrial wastewater spills.
The other four sensors were placed at various locations between the sites described above: at a house near between DILLON Road and Southridge (1.6 miles northwest of Kersey Valley Landfill); at a house near MAIN STREET and Oakdale (.23 miles east of industrial plants Univar Chemical factory, Hood Container and Teknor Apex); and in the backyard of a residence in the centrally-located FORESTDALE East neighborhood.
JAMESTOWN EAST was placed under the second story overhang of a home in the Yorkshire neighborhood, 0.3 miles southeast of the MAIN STREET sensor. This was the most heavily forested setting.
Throughout the entire project, the two sensors that had the thickest tree canopies consistently reported the lowest particulate matter levels (MACKAY2 and JAMESTOWN EAST).
A Jamestown resident on the west side of town purchased a Purple Air sensor in December 2024 and I began including data from this site, called “PENNY RD.” This sensor is the closest to High Point and the traffic of Wendover Avenue, several construction sites and a second Martin Marietta quarry.
COMMUNITY
In September, 2024, after receiving word that our application had been approved for the project, it was announced on The Jamestowner website and reported in our local newspaper, The Jamestown News/YES! Weekly.
On November 13, 2024, I wrote an informational “how-to” blog post for sharing on social media and set up a private Facebook group called “Airheads” for the air sensor hosts and interested residents.

This is where we shared findings, asked questions, and openly discussed what we were seeing and learning. In reviewing the screenshots of the posts from that Facebook group, you can see how over time we learned what to look for – when there were anomalies, trends, how we compared to other parts of the state and country, etc. I also used this channel to notify site hosts when their sensors went offline due to a lost wifi connection or power outage.
Links to the PurpleAir map were shared on our social media sites, and a widget for the MAIN STREET sensor was placed on the sidebar of The Jamestowner website. Social media discussions in public and private groups enabled realtime discussions about realtime observations.
A “what you need to know” post was shared on The Jamestowner site in November 2024 and throughout the project term on social media.
Examples of the “how-to” videos are at the bottom of these two posts: https://thejamestowner9.com/air-sensors-week-one/ AND https://thejamestowner9.com/november-26-2024-photo-of-the-year/
For the most part, everyone found the sensors to be very user-friendly, and the real-time data provided by the online “live” Purple Air map made it easy to visualize and share air quality data, and compare local conditions to communities across North Carolina.
This post from May 2025 bundles the air sensors with other “DIY” monitoring tools.
Because of our town’s small size, our local news network and public services department are limited in how much they can do to keep us informed about environmental events that impact our heath, safety and property. The air sensors added a useful layer of engagement and education to our information-sharing.
In July of 2025 I decided to run for mayor. Since my name was registered as the administrator of the public-facing Jamestowner website and social media accounts, I cut back on the frequency of the posts and limited our “opinion” discussions to the private Airheads Facebook group.
After being elected mayor, I didn’t have as much time to devote to the air sensor project as I did in the beginning, but I did continue with the data downloads. My term is for four years, during which time I hope to see our community’s air monitoring and reporting capabilities expanded.
DATA: TRENDS
The ANNUAL reading for the 12-month period 4/17/25 – 4/16/26 shows average PM2.5 levels in Jamestown of 7.51 µg/m³, slightly higher than the U.S. ANNUAL average of 7.3 µg/m³ and significantly higher than the World Health Organization ANNUAL safety limit of 5µg/m3.


The main sources of PM2.5, as we learned, are diesel engines, industrial processes, and soot and smoke from wildfires and open burning. Particulate matter from leaf blowing and pollen are too big to be picked up by the sensors.


The annual levels of the Jamestown 27282 Community EPA air monitoring project have tracked upward since the project launched in November 2024, with average 12-month levels of 7.27 µg/m³ for 11/15/24-11/14/25; 7.36µg/m³ for 1/1/25-12/31/25; 7.4µg/m³ for 3/1/25-2/28/26; and 7.51µg/m³ for 4/17/25-4/16/26.
Daily (24-hour) averages — In 2021, the World Health Organization defined the maximum safe DAILY limit as 15 µg/m3, at a maximum occurrence of no more than four days a year. Jamestown had 32 DAYs that exceeded 15µg/m3 during the year and a half that the sensors were active.
The highest levels were recorded by the sensors on the Town’s southern and northern borders: RIVERDALE, JAMESTOWN NORTH and PENNY RD.
The 20 worst 24-hour (day) averages for the eight sensors (including the two sensors placed in wooded areas with tree canopies), are shown in the chart below, from highest to lowest:

Monthly averages — Monthly PM2.5 averages for Jamestown 27282 are shown below, highest to lowest:

DATA: OUTLIERS
The sensors arrived in early November, and my husband and I delivered them to the sensor sites through November 12th. It was necessary to visit each location in order to register the sensor using each site’s wifi network.
The first day all eight sensors were “live” and reporting was November 15, 2024. The final day of data collection was April 16, 2026.
The highest AQI (air quality index) spikes of the entire time period occurred on November 23rd (2024), just a couple of weeks after everyone was online. These spikes occurred at the RIVERDALE and MAIN STREET sensor sites (471µg/m³ at RIVERDALE).
On the evening of November 24th, we saw the numbers spike again, this time at the DILLON site. The November 2024 spikes are discussed in more detail in these two posts: https://thejamestowner9.com/air-sensors-week-one/ AND https://thejamestowner9.com/november-26-2024-photo-of-the-year/
During the first few months, we monitored and discussed the sensors almost daily. I downloaded data from the eight sensors at least every two weeks, including screenshots, CVS files and maps.
The data downloads consisted of:
- 24-hour average readings of RAW pm2.5, with EPA conversion (i.e., the EPA’s national correction equation);
- monthly average readings of RAW pm2.5, with EPA conversion;
- weekly average and realtime readings of AQI Index;
- sensor confidence readings for all eight sensors;
- VOC readings from the PENNY RD sensor; and
- Anything else that sparked our interest.
We quickly learned that zooming in and out and taking screenshots of larger areas on the live maps were very useful for seeing how Jamestown compared to communities nearby, across the state and across the country. While bad air is never good, on more than one occasion we were somewhat relieved to learn that our bad air was a subset of what was being experienced by a large swath of the country and not something unique to our area.
However, there were definitely times when the bad air was unique to our area:
December 3-5, 2024 – Very high (Realtime) spikes in AQI were observed at the Jamestown sensor sites, but the numbers weren’t in sync with each other (they weren’t happening at the same times). Spikes also occurred on Dec. 18 and 24, 2024, and January 1-11, 2025. While we have no proof that it’s related, we now know that a lot of burning took place in late fall of 2024 at a brownfield site on the northwest side of town. https://thejamestowner9.com/air-quality/
January 12-13, 2025 – High (Realtime) spikes in Raw pm2.5 with EPA conversion (50µg/m³ to 100µg/m³) occurred between 11pm/midnight until 8am the next morning at the DILLON and PENNY RD sites. Wind was from the southwest, as it was most of the time.
January 24, 2025 – AQI was in the red zone at all locations. January 23-28, 2025 – AQI and Raw pm2.5 (Realtime) was high at all locations (30µg/m³ to 60µg/m³). Again, no proof it’s related, but because of the dates, it’s worth noting that on January 26, 2025, there was a fire at GFL Landfill in which four tons of debris burned. I could find no air permit files for GFL Landfill in the NCDEQ public records database. https://thejamestowner9.com/gfl-landfill/
From January through June of 2024, the AQI, PM2.5 and VOC numbers steadily rose to a peak, and then began to drop. This was observed across all the sensors.
This post provides an overview of some of the reporting highlights through January 2025: https://thejamestowner9.com/air-sensors-week-one/
March 12 and 19, 2025 – Two heavy smoke events occurred on two Wednesdays, one week apart. Facebook and NextDoor lit up with photos and posts. Local residents could see it, smell it, and it stunk up your house if the windows were open. In some parts of town, the smoke was so thick we thought there might be fires in some of the wooded areas. I was driving around town looking for the source when it dawned on me to check the air sensor maps. You could watch the smoke “roll” up like a tumbleweed through Jamestown and Greensboro on the map, as the dots changed from yellow to orange to red and then back to yellow.

We later heard it was from “controlled burns” at Uwharrie (Morrow) Mountain near Asheboro, but nothing was posted on the NC controlled (prescribed) burn map about it, and because there are no active air monitoring sensors between here and Asheboro, we couldn’t confirm the source.
The smoke was unusual, unexpected, and some complained of headaches. The day after the second smoky Wednesday, the governor issued a ban on all burning and burn permits.
Having the ability to share links to the smoke map and Purple Air map was extremely useful and reassuring during this time.
THE PENNY RD SENSOR
As mentioned earlier, one Jamestown resident bought her own PurpleAir sensor (with an experimental VOC sensor) so I began downloading her data along with ours. Her residence is on the west side of town (technically in High Point) and backs up to the woodlands of the Piedmont Environmental Center.
After I started including her VOC readings in our downloads, I immediately noticed: (1) higher AQI and PM2.5 readings on the PENNY RD sensor; (2) surprisingly high AQI/PM2.5 spikes; (3) and some alarmingly high VOC spikes at A&T University in southeast Greensboro.
The VOC and AQI spikes were ongoing (and so high) that one day I drove to A&T to see if I could find the source. It turned out to be a boiler plant in the middle of the A&T campus, near downtown Greensboro. The plant was in noncompliance, and according to a January 2024 article in the Greensboro News & Record, the 25-year old boiler exploded in 2023:
March 26-27, 2025 – VOCs on the PENNY RD sensor averaged 129.6µg/m³ (Realtime) and reached a high of 430µg/m³. Wind was from the southwest at about 7 mph. At 7:27 am, the VOCs reached 473µg/m³. Similar spikes occurred over the next several mornings.
March 26-April 7, 2025 – VOCs on the PENNY RD sensor (one-hour) averaged 121µg/m³. From January 1 through April 8 2025, the one-day average was 93µg/m³. Between mid-February and April 8th, the average rose to between 100µg/m³ and 150µg/m³.
In the graph below, the PENNY RD VOC measurements (the blue line) are compared to other local VOC sensors.

OTHER TAKEAWAYS
+I used the API Keys (and credits) to download more specific information as needed and to fill in the blanks when a sensor went offline (this worked sometimes). I relied heavily on the API downloads to create the final report since the date range was much greater compared to what was available via the Purple Air app. The averages were adjusted to account for “offline” days.
+During the first month of monitoring, we learned that leaf blowers didn’t seem to have much effect on the sensors (it was Fall). This was a key finding as it helped put into perspective how tiny PM2.5 particles are, and gave us a better idea of what we were measuring.
+I used the Wind Rose (online) at PTI airport for wind direction readings (and saw that the wind was blowing from the south/southwest during those high spikes on November 24th/25th in 2024).
+The Purple Air sensors are extremely durable and weatherproof. The measurements were thrown off a little in April due to pollen, in January due to ice storms, and by occasional spiders/spiderwebs.
+Knowing that our air quality numbers are being shared live, in real time, on several national maps (and being archived and averaged), is reassuring to those I spoke with in the community. The general consensus is that we’d rather have “sad” data than no data at all.

+The Environmental Justice maps aren’t (weren’t) doing Jamestown any favors. While the 15,000 residents living in the Jamestown 27282 zip code have Jamestown addresses, live within a 15-sq-mile area, and breathe the same air, the biggest polluters are under the regulatory authority of Greensboro, High Point or Guilford County. Thus, facilities like Eastside Wastewater Treatment Plant, Alberdingk Boley, Martin Marietta’s quarry, APAC asphalt, and the landfills are omitted from the “aggregate” totals of HAP, TAP and Greenhouse Gas sources. Which means if you click on the “Town of Jamestown” (on the Environmental Justice maps), the polluters all lie outside the sample set or across the town’s border, making it appear that there are no air polluters or industrial dischargers impacting the Town of Jamestown and Jamestown 27282. Nothing could be further from the truth.
+The biggest challenge we currently face is the severely diminished oversight resulting from staff cuts and vacancies at NC DEQ. Two weeks ago, I was told the we have no regional Brownfields staff, which may explain why several long-dormant inactive hazardous sites on our town’s perimeter are about to become active, and why the NCDEQ greenlit NCDEQ a concrete and cement trucking and rail distribution facility on 17 acres of a highly contaminated Brownfield site — surrounded by residential and commercial zones.
Jamestown’s air quality levels are already higher than the national average and the entire Jamestown 27282 zip code sits within the Class IV “critical” Randleman Lake Watershed.
Eastside WWTP and Kersey Valley Landfill are emitting increasing amounts of carbon monoxide, mercury, chromium, 1,4-dioxane, PM2.5 and PM10 into the air; Eastside is operating with failing equipment and a permit that has been EXPIRED since 2018; and the City of High Point gave the go-ahead to Kersey and GFL landfills for significant expansions of their waste capacity. Though High Point is the “regulatory authority” for these three facilities, they emit to Jamestown’s air.
I have hundreds of pages of data I’m happy to share with anyone who requests it.
This is what the raw data looks like:
This is what it looks like after rounding to two decimel places, sorting, adjusting the averages for blanks, and applying labels: